Power BI here, Databricks there. Where does one number actually come from?
lab build · Oct 2026 What do we actually have, and what does it mean?
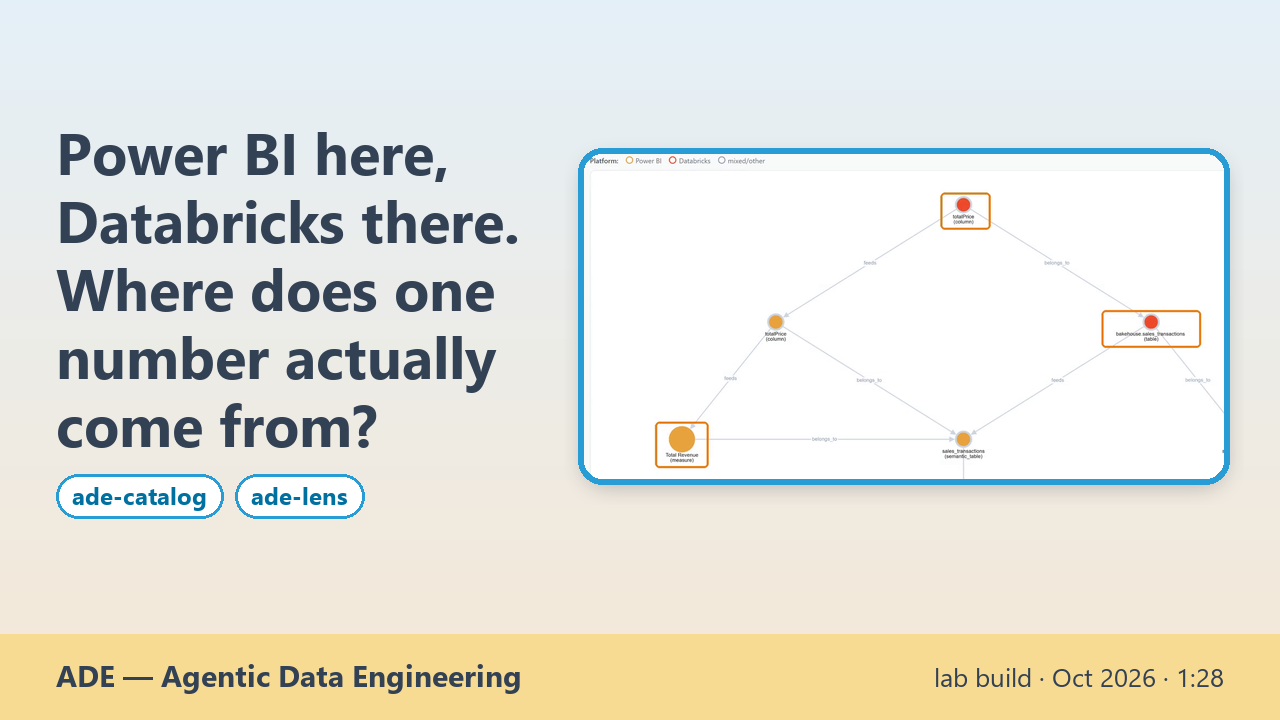
A data estate is rarely one platform: here the reports are in Power BI and the data in Databricks. Someone wants to know where one number comes from. In ade-catalog they do not look for a report: they search for the metric itself, Total Revenue. The catalog shows its definition, the semantic model it lives in and the report that shows it. Then the lineage walks upstream along the whole flow: from the measure to the model's column totalPrice, and from there to the Databricks column and table, samples.bakehouse.sales_transactions, that feed it. Each link says where it comes from. The same map serves the business, who sees what the number means, and the engineer, who sees the exact expression and column.
Then the same metric goes to ade-lens. A business user asks, in plain words that name it, "Total Revenue by country: which one leads?", on the same Power BI model. The answer: Japan leads with 21,591, narrowly ahead of the US (20,736), with a trust badge saying it was composed on the certified model. The query behind it asks the model for Total Revenue itself, and ade-lens shows the metric with the same definition the catalog traced, SUM(sales_transactions[totalPrice]). Two products, one experience: find the metric, trace it, ask it.
What it does not show
- The jump between ade-catalog and ade-lens is a cut in the video. Today they are two separate apps, and no button carries a metric from one into the other yet. The metric is the same one on both sides.
- The lineage stops at the Databricks table: the demo reads Databricks' own sample data, so there is no pipeline above it to trace.
- The link from the Power BI model to Databricks is matched by name on the model's declared source, and the catalog marks it with medium confidence. Its panel shows where the link comes from, not an expression; the DAX is on the measure's page.
- The catalog half is a local lab build: the hosted demo does not show the Databricks side of this model yet.
- "Certified" in ade-lens means certified in ade-lens's own catalog, not an endorsement given in Power BI. ade-lens shows the model under that catalog entry, "Retail Sales — Certified"; it is the same BakehouseSales model that ade-catalog reads.
- The figures were checked against the Power BI model, not re-run on Databricks at the source.
- Both are lab builds, not the public demos.
Transcript
- 0:00 Power BI here, Databricks there. Where does one number actually come from?
- 0:06 One place to look at the whole estate. Demo data.
- 0:13 Search for the metric, not for the report
- 0:20 Its definition, its model, the report that shows it
- 0:27 Data flows from Databricks into Power BI: every step on one map
- 0:37 Down to the column: totalPrice in Databricks feeds the model's totalPrice…
- 0:43 …and that column feeds Total Revenue. Same map for business and IT
- 0:49 Now ask the data, with the same metric
- 0:54 A plain-words question that names the metric, on the same model
- 0:59 Japan leads: 21,591 in Total Revenue, with a trust badge
- 1:06 The query behind it asks the model for Total Revenue itself
- 1:13 Same metric, same definition: SUM(sales_transactions[totalPrice])
- 1:20 Two products. One experience: find the metric, trace it, ask it.
- 1:20 Today they are two apps: the jump in this video is a cut, the metric is the same on both sides.
- 1:20 ade-catalog · ade-lens · lab builds · AI voice · synthetic data · recorded 2026-10
ade-catalog lab build, local, not deployed (commit 97380be, Demo org) · ade-lens lab build, not yet in the public demo (commit 099f441, with a demo-only catalog binding) · a Power BI demo workspace on Databricks sample data · AI voice · synthetic data · recorded 2026-10-20 (ade-lens) and 2026-10-22 (ade-catalog)