Which of our reports answers this?
lab build · Oct 2026 Can a business user trust an answer without opening a dashboard?
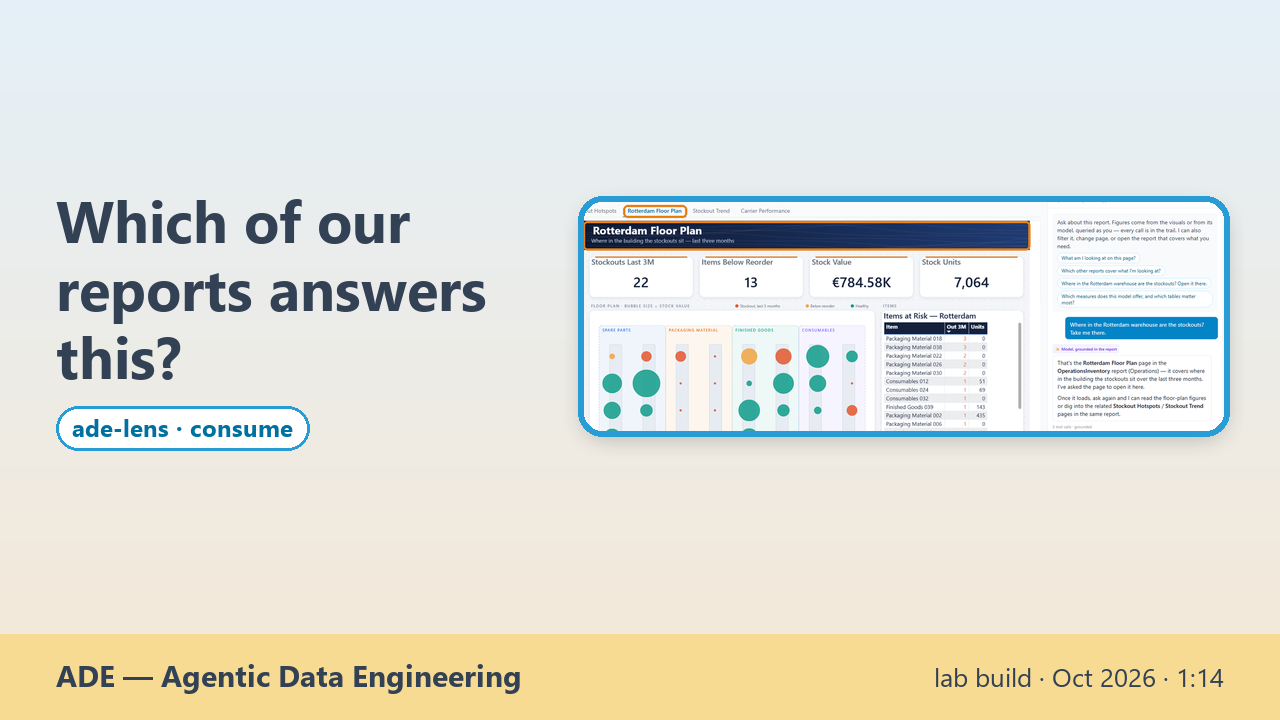
A business user rarely knows which report holds the answer. They only have the question. Here they ask it beside a live Power BI report, and the agent does the navigating. "Which region is behind plan? Show only that one." The answer is East, −8.0% against plan, and the report filters itself through its own slicer, so every figure is read from the page on screen. "Where are the stockouts? Take me there." That answer lives in another report, so the agent opens it, straight on its warehouse floor plan, and its reply names the report and the page it chose. "Which supplier is slipping?" The drop is computed across all 36 suppliers, not picked by eye. Last, the whole report goes to Excel, one sheet per page, as real tables. The answers stand on the reports and models the company already built, used as they are, with the user's own permissions.
What it does not show
- This is a lab build. The public ade-lens demo runs on mock data and does not have this flow yet.
- The reports are found in a small demo estate of four reports, not in an estate of hundreds.
- "Certified" belongs to the company's own reports. ade-lens does not certify anything.
- Power BI is the platform shown. Other platforms are not in this video.
Transcript
- 0:00 Which of our reports answers this?
- 0:03 A live Power BI report on a demo workspace, an AI agent beside it. Synthetic data.
- 0:10 “Which region is behind plan? Show only that one.”
- 0:16 East, −8.0% vs plan — and the report filters itself, through its own slicer
- 0:22 Every figure read from the page on screen
- 0:26 “Where in the Rotterdam warehouse are the stockouts? Take me there.”
- 0:32 Another report, opened straight on its warehouse floor plan
- 0:37 Its reply names the report and the page, and asks the page to open it
- 0:43 “Which supplier's deliveries got worse recently? Take me there.”
- 0:47 Bluepeak Services 07: on time 84.4% → 44.1% — ranked across all 36 suppliers
- 0:52 “Send me this whole report in Excel.”
- 0:57 Real Excel tables, as the visuals show them — 4 pages, 25 visuals
- 1:01 One sheet per page of the report
- 1:05 You bring the question. It finds the report and opens it on the page.
- 1:05 Shown on a demo estate of four reports, not hundreds.
- 1:05 ade-lens · lab build, not yet in the public demo · AI voice · synthetic data · recorded 2026-10-16 and 2026-10-18
ade-lens lab build, not yet in the public demo · Power BI demo workspace · AI voice · synthetic data · recorded 2026-10-18